
Meta title: Clipping Campaign Dashboard: Metrics, Benchmarks & Optimization
Meta description: Learn how to build a clipping campaign dashboard that tracks verified views, engagement quality, creator performance, downstream conversions, benchmarks, alerts, and weekly optimization loops.
Suggested URL slug: /blog/clipping-campaign-dashboard
Primary keyword: clipping campaign dashboard
Secondary keyword: clipping performance metrics 2026
Audience: Founders, growth marketers, agencies, campaign managers, creator operations teams, performance marketers
Search intent: Practical / commercial investigation
Recommended CTA: Get a Free Distribution Audit
Recommended internal links:
| Anchor text | Suggested target |
|---|---|
| Clipping ROI Benchmarks | Recommended new page |
| Advanced Techniques for Top-Performing Clippers | /blog/advanced-techniques-for-top-performing-clippers-from-good-clips-to |
| The Psychology of Viral Short-Form Clips | /blog/the-psychology-of-viral-short-form-clips-data-backed-insights-on-what |
| Briefing, Creative Direction & Quality Control for Clipping Campaigns | /blog/briefing-creative-direction-and-quality-control-for-clipping |
| Multi-Touch Attribution Models for Clipping Campaigns | /blog/clipping-campaign-attribution |
| Brand Lift & Sentiment Measurement from Clipping Campaigns | /blog/brand-lift-clipping-campaign |
| Calculating True CAC via Clipping | /blog/clipping-cac-customer-acquisition-cost |
| How Much Does Clipping Cost? | /blog/how-much-does-clipping-cost-a-complete-guide-for-creators-brands |
Featured Image Prompt
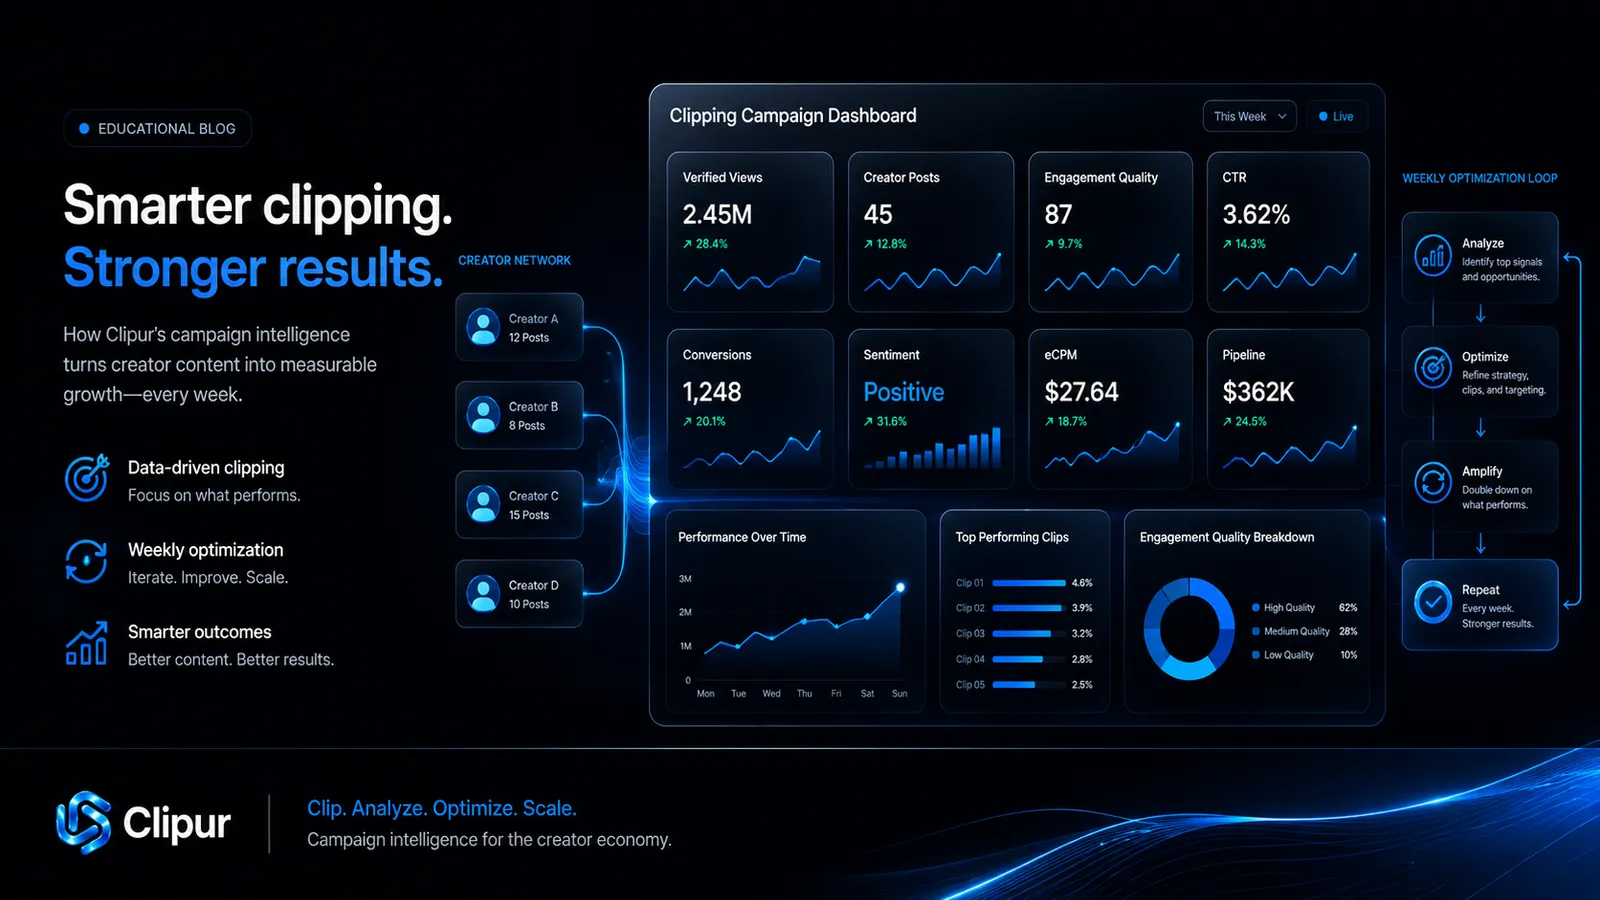
Dark, premium Clipur educational blog hero. Near-black background with electric-blue and cyan gradients. Center visual: a glassmorphism clipping campaign dashboard with cards for “Verified Views,” “Creator Posts,” “Engagement Quality,” “CTR,” “Conversions,” “Sentiment,” “eCPM,” and “Pipeline.” Show alert badges, weekly optimization loops, and creator nodes feeding into performance charts. Metallic blue Clipur icon in footer. Clean SaaS analytics aesthetic. No purple.
Building a Clipping Campaign Dashboard: Key Metrics, Benchmarks, and Optimization Loops
Most clipping campaign reports are too shallow.
They show views, creator posts, and CPM.
That is not enough.
A serious clipping campaign dashboard should tell you five things:
- Is the campaign getting verified distribution?
- Are the right creators producing the right clips?
- Is engagement high quality or low quality?
- Is social attention creating downstream business outcomes?
- What should the campaign team optimize next?
Views matter.
But views alone do not tell you whether a campaign is healthy.
A clipping campaign dashboard should work like an operating system. It should connect creator activity, content quality, distribution velocity, engagement quality, conversion data, brand lift, fraud signals, and campaign optimization into one view.
This guide explains how to build that dashboard.
Direct Answer: What Is a Clipping Campaign Dashboard?
A clipping campaign dashboard is a reporting system that tracks creator-powered distribution from clip submission to verified views, engagement quality, downstream conversions, brand lift, creator performance, and optimization actions.
A strong clipping campaign dashboard should include:
- Verified views
- Active clippers
- Creator posts
- Approval rate
- Rejection rate
- View velocity
- Effective CPM
- Engagement quality
- Sentiment
- CTR
- Website sessions
- Leads
- Conversions
- Pipeline influenced
- Brand search lift
- Fraud flags
- Weekly optimization actions
The goal is not just reporting.
The goal is campaign control.
Why Most Clipping Dashboards Fail
Most dashboards fail because they stop at delivery metrics.
They answer:
“How many views did we get?”
But they do not answer:
“Were those views valuable?”
A weak dashboard tracks:
- Total views
- Total posts
- Total spend
- CPM
A strong dashboard tracks:
- Which creators produced verified views
- Which clips drove high-quality engagement
- Which platforms created downstream traffic
- Which hooks generated positive sentiment
- Which posts attracted buyer-relevant comments
- Which clips created conversions, brand search, or pipeline
- Which campaign variables should be adjusted next
This distinction matters because clipping campaigns are not one-piece content campaigns.
They are distributed systems.
Clipur’s existing guide on advanced clipping techniques explains that top clippers do not think like editors; they think like distributors who optimize for packaging, positioning, timing, narrative, and distribution. (clipur.com)
A clipping campaign dashboard should reflect that same logic.
It should measure distribution quality, not just content output.
The Core Dashboard Structure
A practical clipping dashboard should have seven sections.
| Dashboard section | Purpose |
|---|---|
| Campaign overview | Show total performance at a glance |
| Creator performance | Identify top and underperforming clippers |
| Content performance | Compare clips, hooks, formats, and narratives |
| Engagement quality | Separate real audience response from low-quality activity |
| Conversion tracking | Connect social attention to business outcomes |
| Brand lift and sentiment | Measure awareness, search, perception, and conversation |
| Alerts and optimization | Show what needs action this week |
The dashboard should be simple enough for a founder to understand and detailed enough for a campaign manager to operate.
Section 1: Campaign Overview
This is the executive summary.
It should answer whether the campaign is on track.
| Metric | Definition | Why it matters |
|---|---|---|
| Campaign spend | Total deployed budget | Controls cost efficiency |
| Verified views | Views that pass campaign verification standards | Primary distribution metric |
| Creator posts | Total valid posts submitted | Shows content volume |
| Active clippers | Unique creators posting approved clips | Measures network activation |
| Effective CPM | Spend / verified views × 1,000 | Shows cost per thousand views |
| Approval rate | Approved clips / submitted clips | Measures creator quality |
| Rejection rate | Rejected clips / submitted clips | Flags quality or compliance issues |
| View velocity | Views generated per hour or day | Shows campaign momentum |
| Top platform | Platform producing best outcome | Guides budget and creator focus |
| Top hook | Best-performing message angle | Guides creative optimization |
Executive dashboard example
| Metric | Target | Current | Status |
|---|---|---|---|
| Verified views | 1,000,000 | 640,000 | On pace |
| eCPM | $2.00 | $1.72 | Strong |
| Active clippers | 150 | 118 | Watch |
| Approval rate | 80%+ | 74% | Needs QA |
| CTR | 0.40% | 0.31% | Needs CTA test |
| Leads | 250 | 166 | On pace |
| Positive sentiment | 50%+ | 56% | Strong |
| Fraud flags | <3% | 2.1% | Normal |
This gives leadership the answer quickly.
Then the rest of the dashboard explains why.
Section 2: Creator Performance Metrics
Clipping campaigns are creator networks.
That means creator-level performance is mandatory.
Track every active clipper.
| Creator metric | Definition | Use case |
|---|---|---|
| Clips submitted | Total clips posted by creator | Measures output |
| Clips approved | Posts that pass rules | Measures quality |
| Verified views | Valid views generated | Measures distribution |
| Average views per clip | Verified views / approved clips | Measures creator efficiency |
| Engagement rate | Engagements / views or impressions | Measures audience response |
| Comment quality score | Buyer-relevant comments vs. spam | Measures real engagement |
| CTR | Link clicks / views or impressions | Measures direct-response value |
| Conversion contribution | Leads, signups, or sales influenced | Measures business value |
| Fraud risk score | Risk based on suspicious patterns | Protects campaign integrity |
Creator leaderboard example
| Creator | Approved clips | Verified views | Avg views / clip | Engagement quality | CTR | Status |
|---|---|---|---|---|---|---|
| Creator A | 12 | 182,000 | 15,167 | High | 0.52% | Scale |
| Creator B | 8 | 96,000 | 12,000 | Medium | 0.21% | Watch |
| Creator C | 15 | 41,000 | 2,733 | Low | 0.08% | Coach |
| Creator D | 5 | 9,000 | 1,800 | Suspicious | 0.02% | Review |
The goal is not only to reward the highest views.
The goal is to identify creators who produce valuable attention.
Section 3: Content Performance Metrics
A clipping campaign should test creative variables.
The dashboard should show what is working.
Track:
- Hook type
- Narrative angle
- Source asset
- Clip length
- Caption style
- Platform
- CTA
- Creator category
- Posting time
- Edit style
- Thumbnail or first frame
Clipur’s viral psychology article emphasizes that successful short-form clips spread because they trigger psychological drivers such as curiosity, emotion, identity, status, novelty, and utility. (clipur.com)
Those drivers should become dashboard tags.
Hook taxonomy
| Hook type | Example | What to measure |
|---|---|---|
| Curiosity | “Nobody talks about this…” | Watch rate, retention, CTR |
| Contrarian | “Most brands are doing this wrong…” | Comments, shares, debate |
| Story | “We almost failed before this worked…” | Watch time, saves |
| Data-backed | “This campaign drove 2M views…” | Shares, founder/agency interest |
| Fear / risk | “This is why your content dies…” | CTR, lead quality |
| Utility | “Here’s the framework…” | Saves, shares, qualified traffic |
| Social proof | “300 creators pushed this launch…” | Trust signals, demo intent |
Content performance table
| Clip | Hook type | Platform | Views | Engagement quality | CTR | Conversions | Action |
|---|---|---|---|---|---|---|---|
| Clip 01 | Curiosity | X | 92,000 | High | 0.44% | 18 | Make 3 variations |
| Clip 02 | Utility | 31,000 | High | 0.71% | 24 | Push to B2B creators | |
| Clip 03 | Meme | TikTok | 180,000 | Medium | 0.12% | 9 | Keep for awareness |
| Clip 04 | Product demo | IG Reels | 44,000 | Low | 0.19% | 3 | Rewrite CTA |
A content dashboard should not only rank clips by views.
It should show which clips create business movement.
Section 4: Engagement Quality Metrics
Raw engagement is often misleading.
A post with 1,000 low-quality comments can be less valuable than a post with 40 buyer-relevant comments.
Track engagement quality.
| Engagement quality signal | Strong signal | Weak signal |
|---|---|---|
| Comment relevance | Questions about product, pricing, use case | Generic emojis, repeated phrases |
| Share context | Reposted as endorsement or useful insight | Shared as mockery or spam |
| Saves | Indicates utility or future reference | Not always visible by platform |
| Replies from target buyers | Founders, marketers, agencies, niche buyers | Random low-fit accounts |
| Sentiment | Positive or curious | Negative, confused, hostile |
| Conversation depth | Threads, quote posts, follow-up questions | One-word comments |
| Profile clicks | Audience wants more context | Passive engagement only |
Engagement quality score
Use a simple 1–5 model.
| Score | Meaning |
|---|---|
| 1 | Spam, bots, irrelevant comments |
| 2 | Low-quality generic engagement |
| 3 | Real but low-intent engagement |
| 4 | Relevant curiosity, questions, saves, shares |
| 5 | High-intent buyer comments, inbound DMs, demo interest |
A campaign with a 3.8 engagement quality score is usually healthier than a campaign with high views and a 1.6 quality score.
Section 5: Downstream Conversion Metrics
A clipping campaign dashboard should connect attention to action.
Google Analytics defines an engaged session as a session that lasts longer than 10 seconds, includes a key event, or has two or more page or screen views. That makes engaged sessions more useful than raw sessions when evaluating traffic quality from social distribution. (Google Help)
Google Analytics also allows teams to mark important business events as key events and use reports and explorations to attribute credit across touchpoints. (Google Help)
For clipping campaigns, key events should include the business actions that matter.
Recommended downstream metrics
| Metric | Why it matters |
|---|---|
| UTM sessions | Measures tracked campaign traffic |
| Engaged sessions | Filters low-quality visits |
| Landing page conversion rate | Shows offer-market fit |
| Signup rate | Measures direct response |
| Demo booking rate | Measures B2B intent |
| Add-to-cart rate | Measures commerce intent |
| Checkout conversion | Measures purchase performance |
| Community joins | Measures audience capture |
| CRM leads | Connects social to sales |
| Opportunities created | Connects campaign to pipeline |
| Revenue | Final business outcome |
Conversion dashboard example
| Source | Sessions | Engaged sessions | Signup rate | Demo rate | Customers | CAC |
|---|---|---|---|---|---|---|
| X creators | 4,200 | 2,730 | 8.2% | 1.1% | 14 | $214 |
| TikTok creators | 7,800 | 3,120 | 5.4% | 0.4% | 11 | $273 |
| IG Reels creators | 2,900 | 1,480 | 4.1% | 0.3% | 4 | $420 |
| LinkedIn creators | 1,100 | 890 | 12.6% | 3.8% | 9 | $188 |
This type of view shows that the biggest platform by views may not be the best platform by business outcome.
Section 6: Brand Lift and Sentiment Metrics
Not every clipping campaign is pure direct response.
Some campaigns are designed to increase awareness, recall, trust, and search demand.
Track:
| Brand metric | How to measure |
|---|---|
| Branded search lift | Google Search Console, Trends, SEO tools |
| Direct traffic lift | GA4 direct sessions vs. baseline |
| Social mention volume | Social listening tools |
| Net sentiment | Positive minus negative sentiment |
| Message association | Survey or comment analysis |
| Community growth | Discord, Telegram, newsletter, X, LinkedIn |
| Sales call mentions | CRM notes and self-reported attribution |
| Share of voice | Brand mentions vs. competitors |
Brand lift should not be treated as “soft” if it is measured properly.
A brand lift dashboard helps explain why campaign impact often shows up later through search, direct traffic, retargeting, and sales calls.
Section 7: Platform-Specific Metrics
Every platform needs its own interpretation.
TikTok’s Ads Manager documentation groups reporting metrics into attribution metrics, in-app events, page events, video play metrics, and onsite events, which is a useful framework for separating awareness, engagement, and downstream action. (TikTok For Business)
A clipping dashboard should use the same principle.
X
| Metric | Use |
|---|---|
| Views / impressions | Distribution |
| Reposts | Distribution quality |
| Quote posts | Narrative spread |
| Replies | Conversation quality |
| Profile visits | Interest |
| Link clicks | Direct response |
| Follower growth | Audience capture |
TikTok
| Metric | Use |
|---|---|
| Views | Reach |
| Average watch time | Retention |
| Completion rate | Hook and pacing quality |
| Shares | Distribution quality |
| Saves | Utility |
| Comments | Conversation |
| Profile visits | Interest |
| Link clicks | Direct response |
Instagram Reels
| Metric | Use |
|---|---|
| Plays | Reach |
| Reach | Unique exposure |
| Watch time | Retention |
| Shares | Distribution quality |
| Saves | Utility |
| Comments | Sentiment |
| Profile actions | Interest |
YouTube Shorts
| Metric | Use |
|---|---|
| Views | Reach |
| Viewed vs. swiped away | Hook quality |
| Average view duration | Retention |
| Likes / comments | Engagement |
| Subscribers gained | Audience capture |
| Long-form video clicks | Deeper intent |
| Metric | Use |
|---|---|
| Impressions | B2B reach |
| Reactions | Surface engagement |
| Comments | Conversation quality |
| Reposts | Thought leadership spread |
| Profile views | Buyer interest |
| Follows | Audience capture |
| Website clicks | Direct response |
| Demo conversions | Sales intent |
2026 Social Benchmark Context
Public social benchmarks are not clipping-specific, but they help frame platform expectations.
Quid’s 2026 Social Media Industry Benchmark Report found that TikTok had a median engagement rate of 2.01%, outperforming Instagram, Facebook, and X; it also reported that X engagement rebounded to 0.03% in 2025 after a prior low. (Quid)
Metricool’s 2026 Instagram Study analyzed more than 24.3 million posts across 375,000 accounts and found that Reels and carousels were increasingly aligned with how Instagram distributes and rewards content. (Metricool)
Use these as context, not strict campaign targets.
Clipping campaigns behave differently because they involve creator networks, campaign incentives, niche content, and platform-specific distribution tactics.
Clipping Campaign Benchmark Table by Niche
The following ranges are practical operator benchmarks, not universal guarantees. They should be calibrated against your own historical data, offer, niche, platform mix, source content, and creator quality.
Awareness-focused clipping campaigns
| Niche | Healthy eCPM | Strong engagement quality | Useful benchmark |
|---|---|---|---|
| Crypto / Web3 | $0.75–$3.00 | 3.5+/5 | High view velocity and community discussion |
| AI / SaaS | $1.50–$5.00 | 4.0+/5 | Buyer-relevant comments and demo traffic |
| Podcasts / media | $0.50–$2.50 | 3.5+/5 | Subscriber lift and audience retention |
| Fintech / trading education | $1.50–$6.00 | 4.0+/5 | Trust, saves, qualified questions |
| E-commerce | $1.00–$4.00 | 3.5+/5 | Product clicks and add-to-cart activity |
| Online education | $1.00–$5.00 | 4.0+/5 | Saves, shares, webinar or lead magnet signups |
| Fitness / wellness | $1.00–$4.00 | 3.5+/5 | Saves, shares, transformation interest |
| Events / livestreams | $0.75–$3.50 | 3.5+/5 | RSVP, reminder, or live attendance lift |
Direct-response clipping campaigns
| Niche | Healthy CTR range | Healthy landing page conversion | Key metric |
|---|---|---|---|
| SaaS / AI tool | 0.25%–1.00% | 5%–15% signup | Cost per activated user |
| B2B agency / service | 0.15%–0.75% | 1%–5% demo | Cost per qualified call |
| Crypto / Web3 | 0.20%–1.25% | 5%–25% community join | Cost per wallet, join, or signup |
| E-commerce | 0.30%–1.50% | 1%–5% purchase | Cost per purchase |
| Online education | 0.25%–1.00% | 5%–20% lead capture | Cost per qualified lead |
| Event / livestream | 0.30%–1.50% | 10%–35% RSVP | Cost per attendee |
Creator quality benchmarks
| Metric | Weak | Healthy | Strong |
|---|---|---|---|
| Approval rate | <60% | 70%–85% | 85%+ |
| Rejection rate | >30% | 10%–25% | <10% |
| Average views / approved clip | Low vs. niche baseline | On target | 2x+ target |
| Engagement quality score | <2.5 | 3.0–4.0 | 4.0+ |
| Fraud flag rate | >8% | 2%–5% | <2% |
| Creator concentration risk | Top 3 drive 80%+ | Top 10 drive 50%–70% | Broad distribution |
Alert System for Clipping Campaign Dashboards
Dashboards should not only report.
They should alert.
Campaign health alerts
| Alert | Trigger | Action |
|---|---|---|
| Low view velocity | Campaign below 70% of expected pace after 48 hours | Add creators, refresh hooks, expand platforms |
| High rejection rate | Rejection rate above 25% | Improve brief, clarify rules, coach creators |
| Low approval rate | Approval rate below 70% | Tighten onboarding and examples |
| Rising eCPM | eCPM 30%+ above target | Audit creators and content quality |
| Platform imbalance | One platform drives 80%+ of views | Diversify distribution |
| Creator concentration | Top 3 creators drive most output | Recruit more reliable creators |
| Low CTR | CTR below niche target | Test CTA, caption, landing page |
| Low engaged sessions | Social traffic has weak GA4 engagement | Improve landing page-message match |
| Negative sentiment spike | Negative comments above 20% | Review narrative, compliance, brand safety |
| Fraud risk spike | Suspicious patterns above threshold | Pause payouts pending review |
Creator-level alerts
| Alert | Trigger | Action |
|---|---|---|
| High submissions, low approval | Creator posts often but fails QA | Coach or gate |
| High views, low quality | Views strong but comments suspicious | Audit traffic quality |
| Strong CTR, low views | Creator has buyer-relevant audience but limited reach | Give better clips and priority assets |
| Strong engagement, no conversions | Audience likes content but offer is weak | Adjust CTA or landing page |
| Repeated rule violations | Creator ignores brief | Remove from campaign |
Conversion alerts
| Alert | Trigger | Action |
|---|---|---|
| Tracking break | Sessions or events suddenly drop | Check UTMs, pixels, landing page, forms |
| Lead quality drop | More leads but fewer qualified buyers | Tighten CTA and targeting |
| High bounce / low engagement | Traffic does not match landing page | Create campaign-specific page |
| Demo conversion weak | Traffic engages but does not book | Improve offer, proof, urgency |
| Assisted conversions rising | Direct and branded search rising | Extend attribution window |
Weekly Review Cadence
A clipping dashboard becomes valuable when it drives a weekly operating loop.
Monday: Baseline and campaign health
Review:
- Total verified views
- eCPM
- Active clippers
- Approved clips
- View velocity
- Approval rate
- Rejection rate
- Fraud flags
Decision:
Is the campaign on pace, under pace, or over pace?
Tuesday: Creator optimization
Review:
- Top creators
- Underperforming creators
- Creator-level CTR
- Engagement quality
- Fraud risk
- Approval consistency
Decision:
Which creators should get more assets, more guidance, or removal?
Wednesday: Creative optimization
Review:
- Best hooks
- Best source moments
- Best captions
- Best clip lengths
- Best platforms by format
- Sentiment by narrative angle
Decision:
What creative should be duplicated, rewritten, or stopped?
Thursday: Conversion optimization
Review:
- UTM sessions
- Engaged sessions
- Landing page conversion
- Signup rate
- Demo rate
- Add-to-cart
- CRM leads
- Assisted conversions
Decision:
Is the issue distribution, creative, landing page, offer, or sales follow-up?
Friday: Executive summary and next-week plan
Report:
- What happened
- What worked
- What failed
- What was learned
- What will change next week
Decision:
Should budget increase, remain stable, shift platforms, or pause?
The Clipping Optimization Loop
A clipping campaign dashboard should create a repeatable loop.
Source content → Clip creation → Creator distribution → Verified views → Engagement quality → Conversion data → Creative learning → Next campaign wave
The key is feedback speed.
Every campaign should improve the next batch of clips.
Optimization loop table
| Signal | Interpretation | Optimization |
|---|---|---|
| High views, low engagement | Hook works, content may be shallow | Improve substance and CTA |
| Low views, high engagement | Content is good but distribution is weak | Give to stronger creators |
| High engagement, low CTR | Audience likes content but CTA is weak | Rewrite caption and offer |
| High CTR, low conversion | Landing page mismatch | Improve landing page |
| High negative sentiment | Narrative risk | Adjust messaging |
| High saves, low clicks | Content is useful but not urgent | Add clearer next step |
| High comments, low quality | Possible spam or wrong audience | Tighten creator selection |
| High direct traffic lift | Brand demand created | Connect to attribution model |
This is where the dashboard becomes more than reporting.
It becomes strategy.
Dashboard Layout Recommendation
Page 1: Executive Overview
Include:
- Spend
- Verified views
- eCPM
- Active creators
- Top platform
- Top hook
- Leads
- CAC
- Sentiment
- Alerts
Page 2: Creator Leaderboard
Include:
- Creator name / ID
- Clips submitted
- Clips approved
- Verified views
- Engagement quality
- CTR
- Conversion contribution
- Fraud risk
- Recommended action
Page 3: Content Intelligence
Include:
- Clip ID
- Source asset
- Hook type
- Narrative angle
- Platform
- Views
- Watch quality
- Shares
- Saves
- Comments
- CTR
- Conversions
Page 4: Conversion and Attribution
Include:
- UTM source
- Platform
- Sessions
- Engaged sessions
- Key events
- Leads
- Demos
- Sales
- Pipeline
- Revenue
- Assisted conversions
Page 5: Brand Lift and Sentiment
Include:
- Branded search
- Direct traffic
- Mentions
- Positive / neutral / negative sentiment
- Message association
- Comment themes
- Sales call mentions
- Share of voice
Page 6: Alerts and Weekly Actions
Include:
- Alert type
- Severity
- Owner
- Deadline
- Recommended action
- Status
Sample Dashboard Scorecard
Use this as the campaign manager’s weekly scorecard.
| Category | Score | Notes | Action |
|---|---|---|---|
| Distribution velocity | 8/10 | Views on pace | Maintain |
| Creator quality | 6/10 | Approval rate below target | Improve brief |
| Content quality | 7/10 | Utility clips performing best | Create more frameworks |
| Engagement quality | 8/10 | Strong buyer comments | Scale top creators |
| Conversion quality | 5/10 | CTR weak on TikTok | Test stronger CTA |
| Brand lift | 7/10 | Search and direct traffic rising | Extend attribution window |
| Fraud risk | 9/10 | Low suspicious activity | Continue monitoring |
This format is simple enough for operators and executives.
Common Dashboard Mistakes
Mistake 1: Reporting total views without verified views
Total views can overstate performance.
Verified views should remove duplicates, invalid submissions, rejected posts, suspicious activity, or views outside campaign rules.
Mistake 2: Treating every creator equally
A creator with fewer views but higher buyer intent may be more valuable than a creator with larger generic reach.
Segment creators by value, not output alone.
Mistake 3: Ignoring engagement quality
Engagement volume can be gamed.
Engagement quality is harder to fake.
Read comments.
Classify replies.
Track buyer relevance.
Mistake 4: No platform segmentation
TikTok, X, Instagram, LinkedIn, and YouTube Shorts do not behave the same way.
Separate platform-level dashboards.
Do not force one benchmark across every channel.
Mistake 5: No alert system
If the dashboard only updates after the campaign ends, it is too late.
Dashboards should detect problems during the campaign.
Mistake 6: No weekly optimization loop
A dashboard without decisions is just decoration.
Every review should end with:
- What to scale
- What to stop
- What to rewrite
- Which creators to reward
- Which creators to coach
- Which landing pages to fix
- Which campaign rules to adjust
The 2026 Standard for Clipping Performance Metrics
In 2026, a serious clipping campaign dashboard should measure five layers:
| Layer | Question |
|---|---|
| Distribution | Did we get verified reach? |
| Quality | Was the reach real and relevant? |
| Creative | Which hooks, clips, and narratives worked? |
| Conversion | Did attention become traffic, leads, sales, or pipeline? |
| Learning | What should we optimize next? |
The best dashboards do not only prove performance.
They accelerate performance.
That is the real reason to build one.
Final Takeaway
A clipping campaign dashboard should not be a vanity report.
It should be a control center.
Views and CPM matter, but they are not enough.
The dashboard should show:
- verified distribution
- creator quality
- content performance
- engagement quality
- downstream conversions
- sentiment
- brand lift
- fraud risk
- optimization actions
A campaign with strong dashboard discipline can improve every week.
Better clips.
Better creators.
Better hooks.
Better conversion paths.
Better CAC.
Better brand lift.
That is the difference between running a clipping campaign and operating a creator-powered distribution system.
Want a Clipping Campaign Dashboard Built Around Real Business Metrics?
Clipur helps brands launch creator-powered clipping campaigns across X, TikTok, Instagram Reels, YouTube Shorts, and LinkedIn.
If you want a campaign dashboard that tracks verified views, creator performance, engagement quality, conversions, brand lift, and optimization loops, request a Free Distribution Audit from Clipur.
FAQ: Clipping Campaign Dashboards
What is a clipping campaign dashboard?
A clipping campaign dashboard is a reporting system that tracks creator posts, verified views, engagement quality, creator performance, platform performance, downstream conversions, sentiment, brand lift, and campaign optimization actions.
What metrics should a clipping campaign dashboard include?
A clipping campaign dashboard should include verified views, active clippers, approved clips, rejection rate, eCPM, view velocity, engagement quality, CTR, UTM sessions, engaged sessions, leads, conversions, sentiment, brand search lift, and fraud flags.
Why are verified views important?
Verified views are important because total views can include invalid, duplicated, suspicious, rejected, or non-compliant activity. Verified views give brands a cleaner measure of real campaign distribution.
How do you measure engagement quality in a clipping campaign?
Measure engagement quality by analyzing comment relevance, buyer intent, saves, shares, repost context, sentiment, conversation depth, profile clicks, and suspicious engagement patterns.
What is a good eCPM for clipping campaigns?
A good eCPM depends on niche, platform, creator quality, and campaign objective. As a practical planning range, many awareness-focused clipping campaigns target roughly $0.75–$6.00 eCPM depending on vertical and buyer quality.
How often should a clipping dashboard be reviewed?
A clipping campaign dashboard should be reviewed daily during active campaigns and formally reviewed weekly. Weekly reviews should cover distribution, creator quality, content performance, conversions, sentiment, alerts, and next actions.
What is the biggest mistake in clipping campaign reporting?
The biggest mistake is reporting only views and CPM. A proper dashboard should connect views to creator quality, engagement quality, downstream conversions, brand lift, sentiment, and optimization decisions.
Suggested Schema Markup
Use:
- Article
- FAQPage
- HowTo
- BreadcrumbList
- Organization
Suggested FAQ schema questions:
- What is a clipping campaign dashboard?
- What metrics should a clipping campaign dashboard include?
- Why are verified views important?
- How do you measure engagement quality?
- What is a good eCPM for clipping campaigns?
- How often should a clipping dashboard be reviewed?