
Meta title: Multi-Touch Attribution Models for Clipping Campaigns
Meta description: Learn how to measure clipping campaign attribution, prove clipping ROI, and connect short-form creator distribution to pipeline in 2026.
Suggested URL slug: /blog/clipping-campaign-attribution
Primary keyword: clipping campaign attribution
Secondary keywords: clipping ROI measurement, multi touch attribution short form, short-form attribution, creator distribution ROI
Last updated: July 2026
Audience: Performance marketers, founders, agencies, growth teams, media buyers
Recommended internal links:
- How Much Does Clipping Cost
- The Complete Guide to Clipping in 2026
- The Ultimate X Content Distribution Guide
- Best Clipping Agency in 2026
- Suggested future page: /blog/clipping-roi-benchmarks
- Suggested future page: /blog/paid-clipping-campaigns-guide
Featured Image Prompt
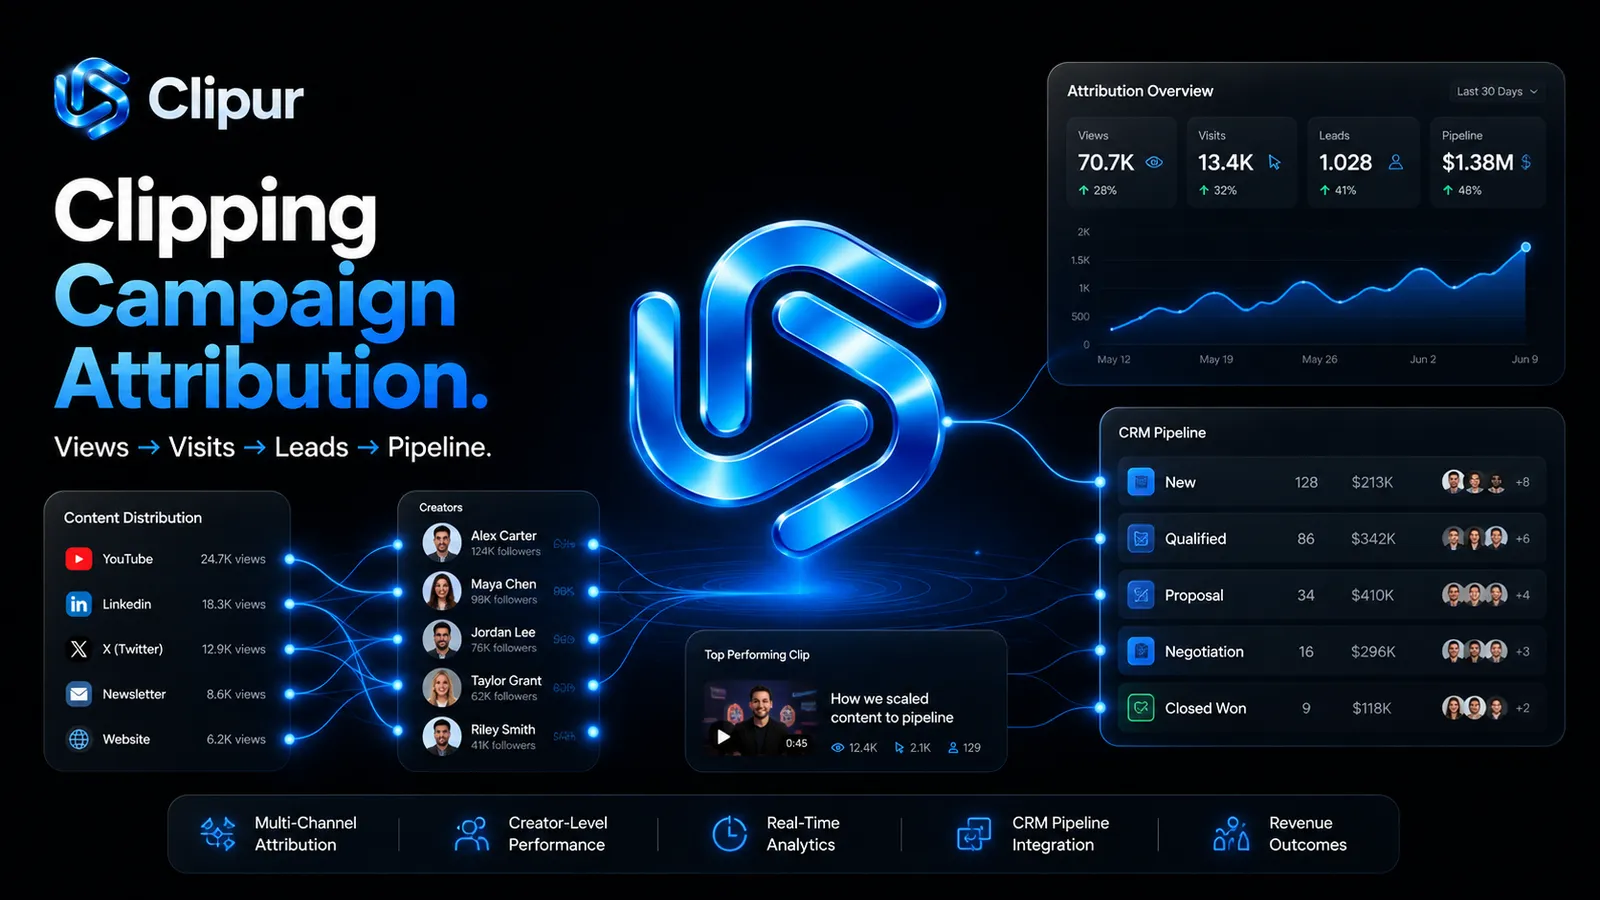
Dark, premium Clipur educational blog hero. Near-black background, metallic electric-blue Clipur icon, glassmorphism attribution dashboard UI, creator nodes flowing into CRM pipeline stages. Headline text: “Clipping Campaign Attribution.” Subheadline: “Views → Visits → Leads → Pipeline.” Use blue/cyan gradients, clean SaaS dashboard cards, no purple.
Multi-Touch Attribution Models for Clipping Campaigns: How to Prove Real Pipeline Impact in 2026
Most brands do not fail at clipping campaign attribution because clipping does not work.
They fail because they try to measure a distributed social campaign with a last-click dashboard.
That is the wrong measurement system.
A clipping campaign does not behave like one paid search ad, one newsletter sponsorship, or one influencer post. It creates dozens, hundreds, or thousands of distributed social touchpoints across creators, platforms, clips, captions, comments, quote posts, reposts, and search behavior.
A buyer may first see a founder clip on X, then see a TikTok repost two days later, search the company name, visit the website directly, read a case study, join the Discord, and finally book a call after a LinkedIn post.
If your attribution model only credits the final website visit, the campaign looks weaker than it really is.
The goal of clipping ROI measurement is not to pretend every view becomes revenue immediately. The goal is to build a measurement system that connects creator-powered distribution to real business outcomes: qualified traffic, signups, demos, pipeline, sales, brand lift, and category recognition.
This guide explains how to build that system.
Direct Answer: What Is Clipping Campaign Attribution?
Clipping campaign attribution is the process of measuring how short-form creator distribution contributes to business outcomes across multiple touchpoints. A proper attribution model tracks the relationship between creator posts, platform views, UTM clicks, website events, CRM leads, brand search lift, direct traffic, assisted conversions, and pipeline influence.
The best attribution model for clipping campaigns usually combines:
- UTM tracking for click-based attribution
- Pixels and server-side events for website behavior
- CRM attribution for leads, demos, opportunities, and revenue
- Brand lift indicators for awareness and search demand
- Multi-touch attribution for assisted influence across the funnel
- Holdout or baseline analysis for incrementality
No single model captures the full impact of short-form creator distribution. The strongest measurement approach triangulates multiple signals.
Why Last-Click Attribution Breaks Clipping ROI Measurement
Last-click attribution gives 100% of the credit to the final touchpoint before conversion.
That can work for simple buyer journeys. It fails when distribution happens across social feeds, creator networks, and repeated exposure.
A clipping campaign creates attention in layers:
- A prospect sees the first clip but does not click.
- They see a second creator post and remember the brand.
- They see a third clip with a stronger hook.
- They search the brand name.
- They visit the site directly.
- They read a case study.
- They book a call later from a retargeting ad, branded search result, or direct URL.
In a last-click model, the campaign may get little or no credit.
That creates a dangerous false negative.
The marketing team may conclude:
“The clipping campaign drove views, but it did not convert.”
The more accurate conclusion may be:
“The clipping campaign created demand, but our measurement system only credited the final capture point.”
This is especially important for B2B, SaaS, crypto, AI tools, agencies, creator-led brands, podcasts, and founder-led companies where buyers rarely convert from the first social impression.
What Traditional Attribution Misses
Traditional attribution often misses the most valuable parts of creator-powered distribution.
| What happened | What last-click sees | What actually matters |
|---|---|---|
| 100 creators post variations of the same product narrative | No direct conversion unless a link is clicked | Category recognition and repeated exposure |
| A founder clip spreads on X and LinkedIn | Maybe a small number of sessions | Audience education, authority, and trust |
| A TikTok clip causes users to search the brand later | Organic search or direct traffic gets the credit | Clipping created the demand |
| A prospect watches three clips, then books a demo from a retargeting ad | Paid ad gets the credit | Clipping warmed the prospect |
| A creator post drives Discord, Telegram, or community joins | May not appear in web analytics | Community acquisition and future pipeline |
| A clip is reposted without the original UTM | Attribution is lost | Earned distribution still occurred |
This is why clipping campaign attribution needs both quantitative and directional measurement.
You want precise tracking where possible and structured inference where precision breaks down.
Why Clipping Campaigns Need Multi-Touch Attribution
A clipping campaign is not just a content campaign.
It is a distributed attention system.
Clipur’s own X distribution guide describes clipping campaigns as a way to incentivize creators to create clips, share clips, amplify clips, and generate visibility across social platforms. That model expands distribution beyond a single brand account into a network of creators and audiences. (Clipur)
That changes attribution.
A single-account campaign can often be measured with a clean source / medium / campaign setup.
A creator-powered distribution campaign needs more detail:
- Which creator posted?
- Which clip performed?
- Which platform drove the most qualified traffic?
- Which hook generated the best downstream conversion?
- Which posts created direct response?
- Which posts created search lift?
- Which audiences produced pipeline?
- Which campaign wave created the highest assisted conversion value?
Without multi-touch attribution, the brand can see surface-level performance but miss pipeline influence.
The Core Attribution Stack for Clipping Campaigns
A modern clipping attribution setup should not depend on one dashboard.
It should combine several layers.
| Layer | Purpose | Tools / data sources |
|---|---|---|
| Campaign tracking | Track creator, platform, clip, hook, and campaign wave | UTMs, short links, landing pages |
| Web analytics | Measure visits, engaged sessions, conversions, assisted paths | GA4, Google Tag Manager |
| Platform events | Track actions after social engagement or ad retargeting | X Pixel / Conversion API, TikTok Pixel / Events API, Meta Pixel / CAPI, LinkedIn Insight Tag / CAPI |
| CRM attribution | Connect leads and opportunities to campaign influence | HubSpot, Salesforce, GoHighLevel, Attio, Pipedrive |
| Revenue attribution | Connect pipeline and closed-won revenue | CRM, Stripe, Whop, payment processor, data warehouse |
| Brand lift | Measure awareness and demand creation | Branded search, direct traffic, social mentions, surveys |
| Incrementality | Estimate what happened because of the campaign | Holdout groups, baseline comparison, geo tests |
Google Analytics supports attribution reports that compare models such as data-driven attribution, paid and organic last click, and Google paid channels last click. Google defines attribution as assigning credit to ads, clicks, and touchpoints along a user’s path to an important action. (Google Help)
That matters because clipping is fundamentally a multi-touch path.
The Recommended Attribution Models for Clipping Campaigns
The best model depends on your budget, funnel, sales cycle, and campaign objective.
1. UTM-Based Attribution
UTM tracking is the foundation.
Google’s campaign URL documentation explains that UTM parameters help identify which campaigns refer traffic and make those values visible inside Analytics reports. (Google Help)
For clipping campaigns, every creator link should include structured parameters.
Recommended format:
utm_source=x
utm_medium=creator_distribution
utm_campaign=clientname_launch_july2026
utm_content=creatorid_clipid_hookangle
utm_term=problem_solution_angle
Example:
https://clipur.com/case-studies/example?utm_source=x&utm_medium=creator_distribution&utm_campaign=ai_launch_july2026&utm_content=creator042_clip017_ai_cmo&utm_term=founder_led_ai
Best for:
- Early campaign testing
- Platform comparison
- Creator-level click tracking
- Landing page conversion analysis
Limitation:
UTMs only measure clicks. They do not capture view-through behavior, branded search lift, screenshots, reposts without links, dark social, or delayed direct visits.
2. First-Touch Attribution
First-touch attribution gives credit to the first known interaction.
For clipping, this is useful when the goal is new audience acquisition.
Example:
A prospect first visits the site from a creator’s X post, leaves, comes back through Google, and later books a demo. First-touch attribution credits the creator post for originating the relationship.
Best for:
- Demand generation
- Top-of-funnel audience acquisition
- New brand discovery
- Founder-led campaigns
Limitation:
It can over-credit the first touch and under-credit later nurture.
3. Last Non-Direct Click Attribution
Last non-direct click ignores direct traffic when another known source was involved before conversion.
This is better than pure last-click because it prevents direct traffic from stealing all the credit.
Example:
A user clicks a creator post on Monday, returns directly on Thursday, and signs up. Last non-direct attribution credits the creator post.
Best for:
- Simple reporting
- Early-stage teams
- Campaigns with short conversion windows
- Basic clipping ROI measurement
Limitation:
It still misses assisted influence from other creator posts and unpaid social exposure.
4. Linear Multi-Touch Attribution
Linear attribution gives equal credit to every known touchpoint.
Example:
A buyer’s path:
- X creator clip
- TikTok clip
- Branded search
- Case study page
- Demo booking
Each touch receives 20% credit.
Best for:
- Multi-platform campaigns
- Longer consideration cycles
- Agencies proving assisted influence
- B2B SaaS and enterprise campaigns
Limitation:
Not every touchpoint is equally valuable. A casual first view may not deserve the same credit as a demo page visit.
5. Position-Based Attribution
Position-based attribution gives more credit to the first and last touches, while distributing the rest across the middle.
A common model is:
- 40% first touch
- 20% middle touches
- 40% final conversion touch
For clipping campaigns, this is often more realistic than linear attribution.
It recognizes that:
- First exposure matters because it creates discovery.
- Final conversion touch matters because it captures intent.
- Middle touches matter because they build familiarity.
Best for:
- Founder-led campaigns
- SaaS demos
- Product launches
- Campaigns where first discovery and final conversion both matter
Limitation:
The weighting is still arbitrary. It is useful, but not perfect.
6. Time-Decay Attribution
Time-decay attribution gives more credit to touchpoints closer to the conversion.
This works when the campaign has a clear promotional window.
Example:
A token launch, product launch, event registration push, webinar, livestream, or limited-time campaign.
Best for:
- Launch windows
- Event campaigns
- Limited-time offers
- Crypto, gaming, livestream, and event campaigns
Limitation:
It may under-credit earlier awareness that made the later conversion possible.
7. Data-Driven Attribution
Data-driven attribution uses observed conversion paths to assign credit based on modeled contribution.
Google Analytics describes data-driven attribution as distributing credit based on data for each key event, using the advertiser’s own account data to calculate contribution. (Google Help)
Best for:
- Mature accounts
- Higher conversion volume
- Paid + organic reporting
- Teams with consistent event tracking
Limitation:
It requires enough clean data. Low-volume campaigns may not produce reliable model outputs.
8. Incrementality and Holdout Testing
Incrementality asks a different question:
What happened because of the campaign that would not have happened otherwise?
This is the strongest form of measurement, but it is harder to run.
Common approaches:
- Compare campaign period vs. pre-campaign baseline
- Compare exposed vs. non-exposed geographies
- Hold back certain audiences or creators
- Compare branded search lift during campaign windows
- Compare direct traffic and demo requests before, during, and after campaign waves
Best for:
- Enterprise budgets
- Large campaign tests
- Performance teams needing budget justification
- Brands comparing clipping against paid social, influencer, PR, or paid search
Limitation:
Requires planning before the campaign starts.
Attribution Model Comparison Table
| Model | Best use case | Good for clipping? | Main weakness |
|---|---|---|---|
| Last click | Simple direct-response campaigns | Low | Misses awareness and assisted influence |
| Last non-direct | Basic web attribution | Medium | Still misses view-through and social lift |
| First touch | Discovery and demand gen | High | Over-credits initial source |
| Linear | Multi-platform campaigns | High | Treats every touch equally |
| Position-based | Founder-led and SaaS campaigns | Very high | Weighting is partly subjective |
| Time decay | Launches and events | High | Under-credits early awareness |
| Data-driven | Mature analytics setups | High | Needs enough clean data |
| Holdout / incrementality | Enterprise proof | Very high | Requires planning and control groups |
The Best Default Model for Most Clipping Campaigns
For most teams, the best default approach is not one model.
It is a three-layer model:
Layer 1: Click Attribution
Use UTMs to measure direct traffic from creator posts.
Track:
- Sessions
- Engaged sessions
- Signup rate
- Demo conversion rate
- Cost per lead
- Cost per signup
- Cost per demo
Layer 2: Assisted Attribution
Use GA4 attribution paths, CRM touchpoints, and multi-touch reporting to measure assisted influence.
Track:
- First-touch creator source
- Last non-direct source
- Assisted conversions
- Pipeline influenced
- Opportunity source
- Time from first touch to conversion
Layer 3: Lift Measurement
Measure whether the campaign increased total demand.
Track:
- Branded search lift
- Direct traffic lift
- Social mentions
- Community joins
- Demo volume
- Referral traffic
- Retargeting audience growth
- Sales conversations mentioning the campaign
This prevents undercounting.
A clipping campaign can drive pipeline even when the final click comes from direct traffic, branded search, retargeting, or a sales follow-up.
Tool Stack for Clipping ROI Measurement
A serious clipping campaign should be instrumented before launch.
1. UTM Builder
Use standardized UTM templates for every creator, clip, hook, and campaign wave.
Recommended naming system:
| Parameter | Example | Purpose |
|---|---|---|
| utm_source | x, tiktok, instagram, youtube, linkedin | Platform |
| utm_medium | creator_distribution | Channel type |
| utm_campaign | brand_launch_july2026 | Campaign name |
| utm_content | creator12_clip09_hook3 | Creator + clip + hook |
| utm_term | founder_story | Angle or keyword |
Do not let every creator create their own link format.
Centralize links before the campaign goes live.
2. GA4 and Google Tag Manager
GA4 should track the full conversion ladder:
- Page view
- Engaged session
- Scroll depth
- Button click
- Signup
- Form submit
- Demo booking
- Checkout
- Purchase
- Key activation event
Server-side Google Tag Manager can improve data quality, privacy controls, and page performance according to Google’s server-side tagging documentation. (Google for Developers)
Google also released 2026 Tag Manager updates related to improved conversion tracking and attribution for Google Ads-linked GA4 properties using server-side Tag Manager. (Google Help)
For teams spending real budget, server-side tracking is increasingly becoming part of the measurement stack.
3. Platform Pixels and Conversion APIs
If clipping campaigns are paired with paid retargeting, pixels and conversion APIs matter.
X’s conversion tracking documentation says advertisers can track actions people take after viewing or engaging with ads, with both X Pixel and Conversion API options available. (X Business)
TikTok Events API allows businesses to share marketing data across web, app, offline, and CRM channels, and TikTok recommends pairing Events API with Pixel for website connections. (TikTok For Business)
LinkedIn Conversions API connects online and offline data to LinkedIn so advertisers can measure influenced website actions, phone sales, and in-person lead collection; LinkedIn also notes that using Conversions API with Insight Tag gives a more complete view through deduplication. (LinkedIn)
For B2B clipping campaigns, LinkedIn CAPI and CRM data are especially useful because many conversions happen after multiple touches.
4. CRM Attribution
The CRM is where clipping ROI becomes real.
A social dashboard can tell you views.
A CRM tells you pipeline.
At minimum, add these fields:
| Field | Purpose |
|---|---|
| First-touch source | Original discovery channel |
| Last-touch source | Final conversion channel |
| Campaign ID | Connects lead to campaign |
| Creator ID | Connects lead to creator where known |
| Clip ID | Connects lead to asset where known |
| Platform | X, TikTok, Instagram, YouTube, LinkedIn |
| Lead source detail | Specific UTM or landing page |
| Self-reported attribution | “How did you hear about us?” |
| Campaign influenced | Yes / no |
| Opportunity value | Pipeline impact |
| Closed-won revenue | Real revenue attribution |
Self-reported attribution is underrated.
Many users will type:
- “Saw you on X”
- “Clipur campaign”
- “TikTok”
- “A founder clip”
- “Someone posted about you”
- “Saw clips everywhere”
That data will not always match UTMs, but it helps reveal dark social influence.
Example Dashboard for a Clipur-Style Campaign
A good dashboard should not only show views.
It should show how views move toward business outcomes.
Dashboard Section 1: Campaign Overview
| Metric | What it tells you |
|---|---|
| Total campaign spend | Budget deployed |
| Total verified views | Reach generated |
| Effective CPM | Cost efficiency |
| Creators activated | Distribution breadth |
| Clips submitted | Creative volume |
| Platforms used | Channel mix |
| Top-performing creators | Who drove attention |
| Top-performing hooks | Which narratives worked |
Dashboard Section 2: Web Performance
| Metric | What it tells you |
|---|---|
| UTM sessions | Click-based traffic |
| Engaged sessions | Traffic quality |
| Landing page conversion rate | Offer-market fit |
| Signup rate | Funnel effectiveness |
| Demo booking rate | B2B intent |
| Cost per signup | Acquisition efficiency |
| Cost per demo | Sales efficiency |
Dashboard Section 3: CRM and Pipeline
| Metric | What it tells you |
|---|---|
| Leads created | Captured demand |
| MQLs | Qualified demand |
| SQLs | Sales-ready demand |
| Opportunities created | Pipeline impact |
| Pipeline influenced | Assisted value |
| Closed-won revenue | Revenue impact |
| Sales notes mentioning campaign | Qualitative proof |
Dashboard Section 4: Brand Lift
| Metric | What it tells you |
|---|---|
| Branded search lift | Demand creation |
| Direct traffic lift | Memory and recognition |
| Social mentions | Conversation growth |
| Community joins | Audience acquisition |
| Retargeting pool growth | Future paid efficiency |
| Inbound DMs | Founder-led demand |
Dashboard Section 5: Attribution Model Comparison
| Model | Revenue credited | Pipeline credited | Use this to understand |
|---|---|---|---|
| Last click | Low / medium | Low | Direct response |
| First touch | Medium / high | Medium / high | Discovery |
| Linear | Medium | Medium | Assisted influence |
| Position-based | Medium / high | High | Full journey |
| Incrementality | Highest confidence | Highest confidence | True lift |
The point is not to force every model to agree.
The point is to understand the range.
If last-click shows low ROI but first-touch, assisted pipeline, direct traffic lift, and branded search all increase during the campaign, the campaign probably created demand that last-click could not see.
Real Campaign Example: Founder-Led AI Launch
A Clipur case study on a founder-led AI campaign describes how Fastlane used a coordinated clipping and creator distribution campaign to create repeated exposure across X, resulting in 10M+ total campaign views and a launch narrative that became difficult for the target audience to miss. The case study also references ARR growth from approximately $250K to $500K and then $1M+. (Clipur)
The attribution lesson is clear:
A campaign like this should not be judged only by immediate UTM conversions.
It should be measured across:
- Founder visibility
- Product recognition
- Branded search
- Direct traffic
- Demo requests
- Signups
- Social mentions
- Retargeting pool growth
- CRM pipeline
- Revenue influenced
A high-performing clipping campaign often creates a market condition where the product feels more visible, more familiar, and more credible.
That visibility is measurable, but only if the dashboard is built to capture it.
Common Clipping Attribution Pitfalls
Pitfall 1: Measuring Only Views
Views matter, but views are not the whole ROI story.
A million views from the wrong audience may do less than 100,000 views from a concentrated buyer segment.
Always segment by:
- Platform
- Creator
- Audience
- Hook
- Landing page
- Conversion quality
- Pipeline quality
Pitfall 2: Using One Generic Link
If every creator uses the same link, you lose creator-level attribution.
Every creator should have a unique link or unique UTM content value.
At minimum, track:
creator_id
clip_id
platform
hook_angle
campaign_wave
Pitfall 3: Ignoring Direct and Branded Search Lift
A user who sees five clips may search the brand later.
That conversion may appear as organic search or direct traffic.
Compare pre-campaign vs. campaign-period trends for:
- Brand-name search
- Direct traffic
- Homepage traffic
- Pricing page traffic
- Demo page traffic
- Case study page traffic
Pitfall 4: Not Connecting CRM Data
A social dashboard cannot prove pipeline alone.
You need CRM events.
For B2B, the most important metrics are usually:
- Qualified leads
- Sales conversations
- Opportunities
- Pipeline influenced
- Closed-won revenue
- Average deal size
- Sales cycle acceleration
Pitfall 5: Over-Crediting the Final Capture Channel
Retargeting ads, branded search, and direct visits often capture demand that was created elsewhere.
If a clipping campaign warms the market and a retargeting ad captures the conversion, both channels matter.
Do not let the final click erase the demand source.
Pitfall 6: No Baseline
Without a baseline, you cannot measure lift.
Before launching, record the previous 14–30 days of:
- Direct traffic
- Branded search
- Organic social traffic
- Demo requests
- Signup volume
- Sales calls booked
- Community joins
- Social mentions
- Revenue
Then compare campaign-period and post-campaign performance.
When to Use Each Attribution Model
| Campaign type | Recommended model | Why |
|---|---|---|
| Small test campaign | UTM + last non-direct | Simple and fast |
| Founder-led launch | First-touch + position-based | Measures discovery and conversion |
| SaaS demand gen | CRM multi-touch + position-based | Captures long sales cycles |
| E-commerce campaign | UTM + pixel + server-side events | Tracks purchases and retargeting |
| Crypto or Web3 campaign | UTM + community joins + brand lift | Users often convert through communities |
| Podcast clipping campaign | First-touch + brand lift | Clips often drive recognition before clicks |
| Enterprise campaign | Incrementality + CRM attribution | Requires stronger proof |
| Always-on clipping | Data-driven + assisted conversions | Best for recurring campaign volume |
The 2026 Clipping Attribution Framework
Use this five-part framework.
1. Define the Conversion Ladder
Before launch, define what success means.
Example ladder:
- Verified view
- Profile visit
- Link click
- Website session
- Engaged session
- Signup
- Activation
- Demo booked
- Opportunity created
- Closed-won revenue
Not every campaign needs every stage.
But every campaign needs a clear ladder.
2. Tag Every Distribution Asset
Each clip should have a unique identifier.
Track:
- Campaign ID
- Creator ID
- Clip ID
- Hook angle
- Platform
- Posting date
- CTA
- Landing page
- UTM link
This makes campaign analysis possible after the content goes live.
3. Separate Direct Response From Demand Creation
A direct-response clip gets users to click immediately.
A demand-creation clip makes users remember, search, follow, or talk about the brand.
Both are useful.
Measure them differently.
| Clip type | Primary metric | Secondary metric |
|---|---|---|
| Direct CTA clip | Clicks, signups, demos | Cost per conversion |
| Founder clip | Watch time, shares, branded search | Pipeline influence |
| Educational clip | Saves, comments, site visits | Newsletter / community joins |
| Meme clip | Reach, reposts, mentions | Brand recall |
| Product demo clip | CTR, trials, demo bookings | Activation rate |
4. Compare Attribution Models Weekly
Do not wait until the end of the campaign.
Every week, compare:
- Last-click conversions
- First-touch conversions
- Assisted conversions
- CRM opportunities
- Search lift
- Direct traffic lift
- Platform engagement
- Creator-level performance
This shows whether the campaign is driving immediate conversions, assisted influence, or top-of-funnel awareness.
5. Make Budget Decisions From Blended Evidence
The final ROI decision should combine:
- Cost per verified view
- Cost per engaged session
- Cost per lead
- Cost per qualified lead
- Cost per demo
- Pipeline influenced
- Closed-won revenue
- Branded search lift
- Direct traffic lift
- Sales feedback
The most expensive mistake is cutting a campaign because last-click looks weak while every other demand signal is improving.
Clipping ROI Formulas
Cost Per Verified View
Cost per verified view = campaign spend / verified views
Effective CPM
Effective CPM = campaign spend / verified views × 1,000
Cost Per Lead
Cost per lead = campaign spend / leads generated
Cost Per Qualified Lead
Cost per qualified lead = campaign spend / qualified leads
Pipeline Influenced ROI
Pipeline influenced ROI = pipeline influenced / campaign spend
Closed-Won ROI
Closed-won ROI = closed-won revenue attributed or influenced / campaign spend
Blended Clipping ROI
Blended ROI = direct revenue + assisted revenue + estimated pipeline value + brand lift value
Blended ROI should be used carefully.
Do not inflate it with fake assumptions.
Use conservative, base, and upside scenarios.
Conservative vs. Aggressive Attribution
Performance teams should report clipping ROI in ranges.
Conservative Case
Only count:
- Tracked UTM conversions
- CRM leads with known source
- Closed-won revenue with clear attribution
Base Case
Count:
- UTM conversions
- First-touch leads
- Assisted conversions
- CRM opportunities influenced
- Branded search lift during campaign window
Upside Case
Count:
- Direct traffic lift
- Retargeting audience growth
- Sales conversations mentioning the campaign
- Community growth
- Long-tail content discovery
This prevents overclaiming while still showing the full impact.
How Clipur Helps Teams Think About Attribution
Clipur is built around creator-powered distribution, not just content editing.
That matters for attribution because the value of a clipping campaign is not simply the number of files produced. It is the number of distribution events created, the number of creators activated, the amount of verified attention generated, and the downstream business outcomes influenced.
Clipur-style reporting should help brands understand:
- Which creators drove the most visibility
- Which hooks generated the most engagement
- Which platforms produced the highest quality traffic
- Which clips created the most downstream demand
- Which campaign waves increased brand search, site traffic, and pipeline
- Which budget levels produced enough signal to make a real decision
The goal is simple:
Turn short-form distribution into measurable business infrastructure.
Final Takeaway
The future of clipping ROI measurement is not last-click attribution.
It is multi-touch, multi-signal attribution.
A serious clipping campaign should be measured across views, engagement, clicks, site behavior, CRM records, brand lift, direct traffic, search demand, pipeline, and revenue.
Last-click tells you who captured the conversion.
Multi-touch attribution tells you who created the demand.
That distinction matters.
In 2026, the brands that win will not only create more content. They will build better distribution systems, better measurement systems, and better feedback loops between social attention and real pipeline.
If your team is investing in short-form creator distribution, do not ask only:
“How many views did we get?”
Ask:
“What did those views cause?”
That is the question clipping campaign attribution is designed to answer.
Want to Measure Your Clipping ROI?
Clipur helps brands launch creator-powered clipping campaigns across X, TikTok, Instagram Reels, YouTube Shorts, and LinkedIn.
If you want to understand how your content can turn into distributed attention, verified views, qualified traffic, and measurable pipeline, request a Free Distribution Audit from Clipur.
FAQ: Clipping Campaign Attribution
What is clipping campaign attribution?
Clipping campaign attribution is the process of measuring how creator-distributed short-form content contributes to traffic, leads, pipeline, revenue, branded search, direct traffic, and other business outcomes.
What is the best attribution model for clipping campaigns?
The best attribution model is usually a hybrid model that combines UTM tracking, first-touch attribution, assisted conversions, CRM attribution, and brand lift measurement. For B2B and founder-led campaigns, position-based attribution is often more useful than last-click attribution.
How do you measure clipping ROI?
Measure clipping ROI by tracking campaign spend, verified views, effective CPM, UTM sessions, engaged sessions, leads, qualified leads, demos, opportunities, pipeline influenced, closed-won revenue, branded search lift, and direct traffic lift.
Why does last-click attribution undercount clipping campaigns?
Last-click attribution undercounts clipping campaigns because short-form creator distribution often creates awareness before users click or convert. A buyer may see several clips, search the brand later, and convert through direct traffic, branded search, retargeting, or sales outreach.
Can short-form video be tied to pipeline?
Yes. Short-form video can be tied to pipeline when campaign links, UTMs, website events, CRM fields, self-reported attribution, and opportunity data are structured correctly before launch.
What tools are needed for clipping attribution?
A strong clipping attribution setup typically includes UTMs, GA4, Google Tag Manager, platform pixels, conversion APIs, a CRM, landing pages, dashboard reporting, and baseline measurement.
Should clipping campaigns use promo codes?
Promo codes can help, especially for consumer, creator, e-commerce, and crypto campaigns. However, promo codes should not be the only attribution method because many users will search, click, or convert without using the code.
How long should the attribution window be for clipping campaigns?
For direct-response campaigns, a 7–14 day window may be enough. For B2B, SaaS, founder-led, and high-consideration campaigns, attribution windows may need to extend 30–90 days depending on the sales cycle.
Suggested Schema Markup
Use:
- Article
- FAQPage
- HowTo
- BreadcrumbList
- Organization
Suggested FAQ schema questions:
- What is clipping campaign attribution?
- What is the best attribution model for clipping campaigns?
- How do you measure clipping ROI?
- Why does last-click attribution undercount clipping campaigns?
- Can short-form video be tied to pipeline?
- What tools are needed for clipping attribution?